Limitations of NEP as a Lidar APD Photoreceiver Performance Metric
Introduction
Noise-equivalent power (NEP) is often used to express the voltage noise at the output of a photoreceiver amplifier in terms of an equivalent optical-signal level. However, avalanche photodiode (APD) receivers of the same NEP may differ substantially in terms of the amplitude distribution of the noise, resulting in substantial variation of the detection threshold required to extinguish false alarms. Thus, NEP alone is not a good measure of the sensitivity of a lidar receiver that employs an APD. The optical signal required to achieve a specified detection probability for a detection threshold that achieves a specified false-alarm rate is shown to be a more reliable characterization of APD photoreceiver performance for lidar applications.
Noise Equivalent Power and Noise Equivalent Input
Photoreceiver noise-equivalent power (NEP) can be an informative metric, but using NEP to evaluate lidar receiver performance comes with the limitation that the NEP of an APD receiver does not fully describe its receiver operating characteristic (ROC). The ROC of a lidar receiver is a parametric plot of the receiver’s pulse-detection probability (Pd) for a specified signal level versus its false-positive rate, which can be determined from the receiver’s false-alarm rate (FAR); both vary as functions of the detection threshold of the lidar pulse-detection circuit. NEP uniquely characterizes the trend of FAR with threshold for non-APD receivers, but two APD receivers with the same NEP may have significantly different FAR characteristics.
NEP and noise-equivalent input (NEI) are often used to express the voltage noise at the output of a photoreceiver amplifier in terms of an equivalent optical-signal level that, if present at the detector input, would result in an output voltage swing of the same magnitude as the noise. Although NEP (W) and NEI (photons) can be defined in such a way as to quantify the signal level for which the signal-to-noise ratio is unity, these metrics are more typically used to quantify the noise present in dark conditions, without signal shot noise.
A block diagram of an APD-based lidar photoreceiver is shown in Figure 1, where the output voltage noise (Vn) is the standard deviation of the potential at the transimpedance amplifier output (Vout) under dark conditions.
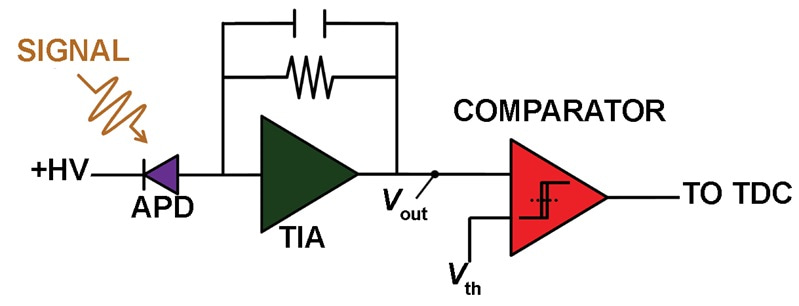
Figure 1: Block diagram of an APD-based lidar photoreceiver.
The deflection of Vout in response to a pulsed optical signal is written as either:
Equation 1:

Equation 2:

where Vs is the peak output voltage that results from a pulsed optical signal, Ps is the peak instantaneous optical power of the signal in Watts, Vd is the output voltage when no signal is present, Ns is the total photon count of the signal pulse, QE is the quantum efficiency of the APD, M is the mean avalanche gain of the APD, λ is the signal wavelength in microns, q is the elementary charge in Coulombs, h is Planck’s constant in J·s, c is the speed of light in m/s, ΩTIA is the amps-to-volts transimpedance of the amplifier in Ω, and GTIA is the electrons-to-volts conversion gain of the amplifier in V/e-. The noise-equivalent signals can then be written:
Equation 3:
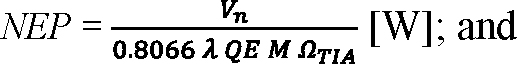
Equation 4:
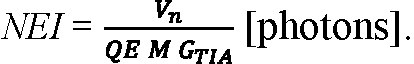
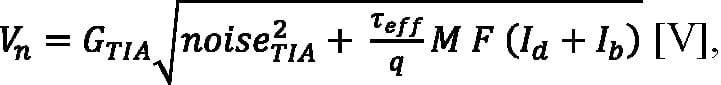
In general, ΩTIA and GTIA depend on the signal pulse shape, so NEP and NEI are specific to the signals to which the dark noise is referred. Just as NEP refers the output-voltage noise to an instantaneous signal power and NEI refers the output-voltage noise to a total photon count, the output-voltage noise itself can be modeled as arising from either the APD’s instantaneous dark current or the cumulative charge delivered by the dark current over an effective integration time:
Equation 5:

Equation 6:
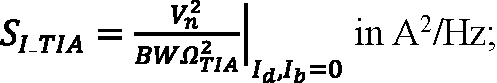
where BW is the bandwidth of the receiver’s analog signal chain into its comparator in Hz; SI_TIA is the spectral intensity of the input-referred noise of the amplifier averaged over its bandwidth, expressed as:
Equation 7:
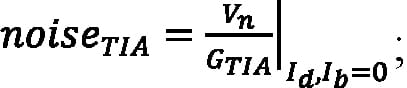
F is the excess noise factor of an APD with ionization rate ratio k, expressed as F = k M + (1 – k) (2 – 1/M); Id is the multiplied DC dark current in amps; Ib is the background photocurrent in amps; noiseTIA is the input-referred noise of the amplifier in units of electrons, expressed as:
Equation 8:
and τeff is effective integration time in seconds.
In most lidar receiver use cases, the pulse-detection threshold is adjusted to extinguish false alarms until a permissible FAR is achieved (such as 60 Hz); then, lidar sensitivity is expressed at that FAR as the signal level for which a pulse-detection probability (Pd) of some desired value is achieved (such as Pd = 95%). The FAR requirement determines the pulse-detection threshold, and the pulse-detection threshold determines the pulse-detection probability. Analyzing the FAR and the pulse-detection probability requires the statistical distribution of Vout, which is not adequately summarized by NEP or NEI.
Limits in Approximating Receiver Metrics — Gaussian Distributions Do Not Suffice
It is common to approximate the probability distribution of Vout as a normalized Gaussian distribution (Figure 2).
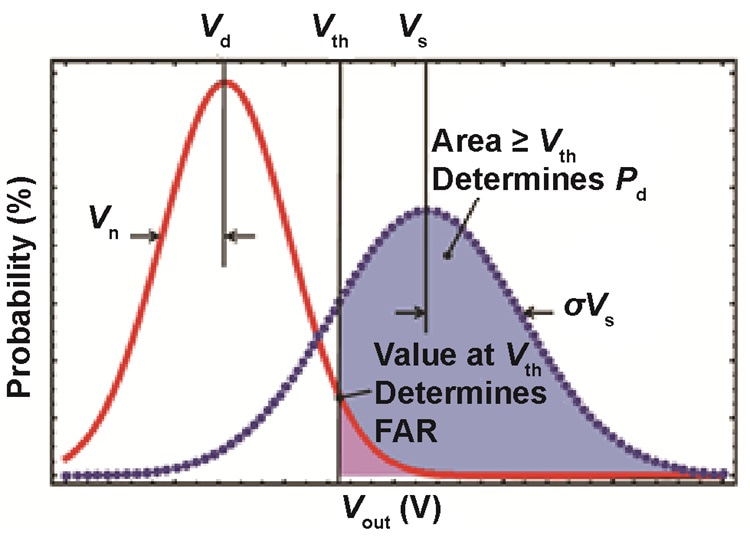
Figure 2: Statistical distributions of Vout for conditions with (dashed curve) and without (solid curve) the presence of an optical-signal return.
The mean and standard deviation characterizing the output distribution under dark conditions are respectively Vd and Vn and, when a signal is present, Vs and σVs. Equation 5 and Equation 6 give the receiver’s dark noise (Vn); the standard deviation of Vout when a signal is present can be written:
Equation 9:

Equation 10:

Signal shot noise is treated in Equation 9 as though the peak photocurrent is DC, which is only a good approximation for rectangular signal pulses of duration longer than the APD response time. The mean photoresponse (Vs) is the sum of Vd and the voltage step (ΔVs) given by Equation 1 and Equation 2.
The Gaussian approximation is generally accurate enough to calculate the pulse-detection probability using its complementary cumulative distribution function (CCDF) evaluated at some detection threshold voltage:
Equation 11:
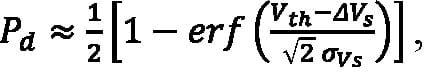
where Vth is the pulse-detection threshold, which is measured relative to Vd, allowing Vs to be replaced with ΔVs.
The Gaussian distribution is not a sufficient approximation to calculate FAR for photoreceivers assembled from APDs characterized by larger values of the ionization rate ratio (k). APD photoreceivers are usually operated with a detection threshold set high enough to extinguish false alarms by a factor on the order of a million, such that FAR is sensitive to the detailed shape of the false-alarm-amplitude distribution many standard deviations above the mean amplitude. The true distribution of Vout under dark conditions is the convolution of a Poisson-weighted McIntyre distribution representing the APD multiplied dark current (PAPD) and a Gaussian distribution representing the input-referred noise of the amplifier (PTIA):
Equation 12:
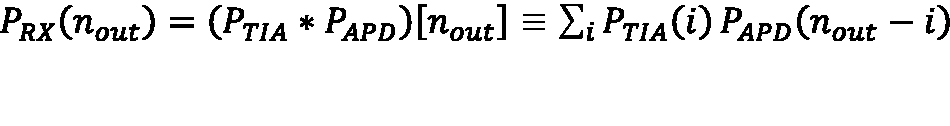
where PRX(nout) is the probability of measuring Vout = GTIA × nout, and nout is the equivalent signal electron count required to achieve Vout.
The APD photoreceiver FAR is the probability density in time that Vout is at the pulse-detection threshold with a positive slope:
Equation 13:
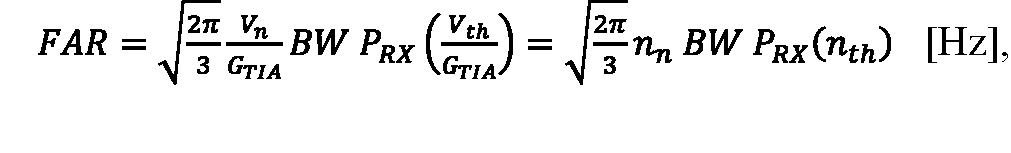
where the conversion gain (GTIA) is used to express Vn and Vth as equivalent input electron counts, nn and nth.
NEP and FAR both depend on the output-voltage noise, but NEP alone does not determine FAR. The dependence of FAR on the distribution of Vout, represented in Equation 12 by PRX(nout), makes FAR sensitive to k and M such that combinations of k and M that result in the same NEP can result in different values of FAR.
Understanding Far and Its Relationship with Other Metrics
The relationship of FAR to k, M, and NEP is best demonstrated by example. For instance, three photoreceivers with the same NEP are described in Table 1, where Receiver 1 has a larger ionization-rate ratio than Receiver 2 and Receiver 3 (k = 0.2 vs. k = 0.02). As a result, Receiver 1 has a larger excess-noise factor (F = 5.6 vs. F = 2.3 at M = 20). To match the NEP of Receiver 1, despite lower k, Receiver 2 is operated at lower avalanche gain and Receiver 3 is assigned higher primary (unmultiplied) dark current.
FAR characteristics for each of the receivers described in Table 1 are plotted in Figure 3 versus detection threshold. Lidar sensitivity, defined as the mean signal level for which a specified pulse-detection probability and FAR are achieved, is compared in Figure 4 for FAR in the range of 1 to 150 Hz and a pulse-detection probability of 95%. Although all three receiver configurations are characterized by the same NEP, they differ in sensitivity. Thus, NEP alone is not a good measure of lidar receiver sensitivity.
Table 1: Characteristics of Three Example Lidar Systems Having the Same NEP
| Parameter | Receiver 1 | Receiver 2 | Receiver 3 |
| TIA Bandwidth (BW) | 100 MHz | ||
| TIA Input Noise (noiseTIA) | 400 e- | ||
| TIA Input Noise Spectral Intensity | 1.64 x 10⁻²⁴ A2/Hz | ||
| TIA Integration Time (τeff) | 5 ns | ||
| TIA Conversion Gain (GTIA) | 32 μV/e- | ||
| TIA Transimpedance (ΩTIA) | 1MΩ | ||
| APD Ionization Rate Ratio (k) | 0.2 | 0.02 | 0.02 |
| APD Gain (M) | 20 | 13 | 20 |
| APD Excess Noise Factor (F) | 5.6 | 2.1 | 2.3 |
| Primary APD Dark Current (Id/M) | 5 nA | 5 nA | 12 nA |
| APD Quantum Efficiency (QE) | 80% | 80% | 80% |
| nn | 712 e- | 465 e- | 712 e- |
| NEI |
44.5 photons |
44.7 photons |
44.5 photons |
| NEP (at λ =1.55 μm) | 1.1 nW | 1.1 nW | 1.1 nW |
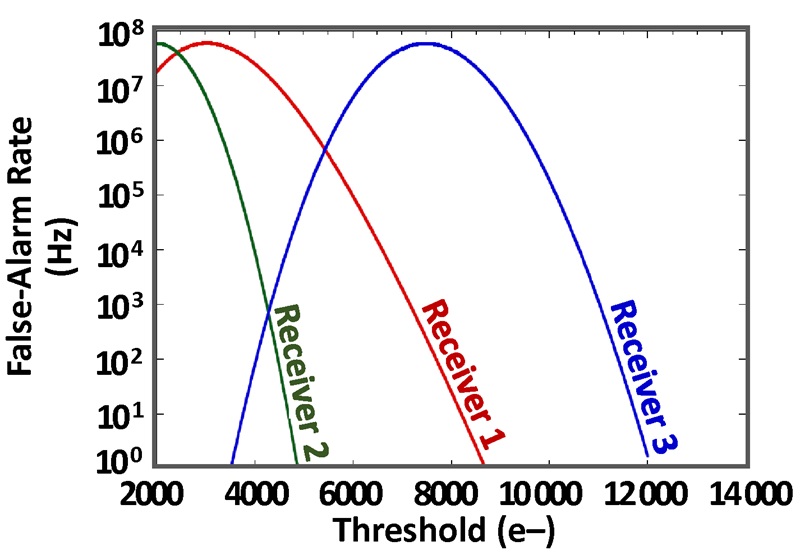
Figure 3: FAR versus detection threshold for the three receivers of Table 1, which all have the same NEP.
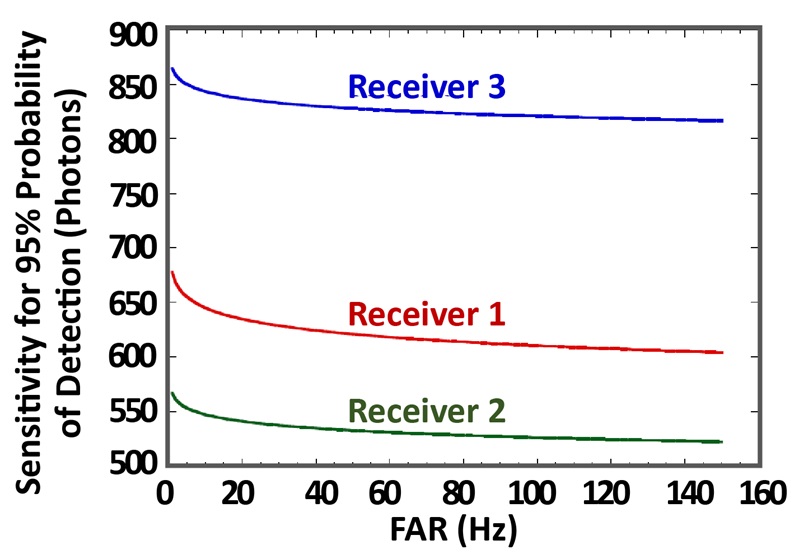
Figure 4: Sensitivity versus FAR for the three receivers of Table 1 which all have the same NEP. The sensitivity is defined as the signal level in photons at which the pulse-detection probability is 95%.
Conclusion
As demonstrated in this paper, receivers of the same NEP may differ substantially in terms of the amplitude distribution of their noise, and therefore the input-signal level required to reliably exceed the detection threshold that must be set to extinguish false alarms. Instead of optimizing dark current, gain, and excess-noise factor to minimize NEP, it is better practice to optimize for sensitivity at a FAR and detection efficiency appropriate to an application.